Introduction
The D5 Smart Meter design exercise was a group project undertaken in my second year. It involved designing, manufacturing, programming, and testing a prototype smart electricity meter whilst working to a financial budget and meeting product specifications.
The group consisted of myself and four other students, and lasted eight weeks. The project required time management, team working skills, and proper documentation of the work undertaken.
Specification
The smart meter had to be capable of controlling a micro grid, where it would control how much mains electricity to consume in conjunction with the incoming power from renewable sources to power the various connected loads and the charging/discharging of a battery. For the purposes of testing and assessment, the energy sources and loads were simulated with signals from a LabVIEW pre-programmed testbed provided by the department.
The smart meter had to be based around the Il Matto, an 8-bit microcontroller that is programmed in C. The Il Matto had to be powered by a 230V AC supply, which meant using appropriate circuitry to convert the supply to the required 5V DC, and had to interface with a variety of signals that represented the different loads and energy supplies.
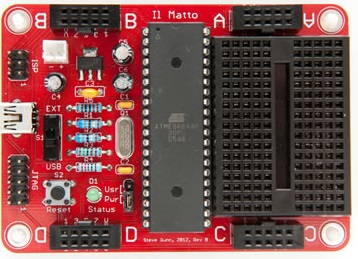
Other specifications include the meter having to comply with IEC 62053-22 by consuming less than 2W of energy. A continuous log of the energy consumption and status of the energy sources and loads had to be recorded by the Il Matto and displayed, and the entire meter had to be housed in a bespoke IP55 compliant housing to prevent against water and dust.
Group Management
To stay on track throughout the project, the group held regular meetings throughout the period to allocate tasks, review progress, and work collectively on the reports. The implementation of the project was split into four main categories:
- Housing
- Power supply
- Interface circuitry
- Software and display
The housing and power supply were the immediate priorities due to the intermediate project deadlines; two members of the team were assigned to each task. The remaining team member worked on the interface circuitry, which was less of a priority and was worked on throughout the project. I was in the pair assigned the task of creating the housing, and then on completion we worked on the software and display.
Group roles were also allocated, these were Leader, Secretary, and Budget Manager. I had the role of Secretary, and was responsible for writing up meeting minutes, tracking progress, and maintaining the group’s Gantt chart.
Implementation
Housing
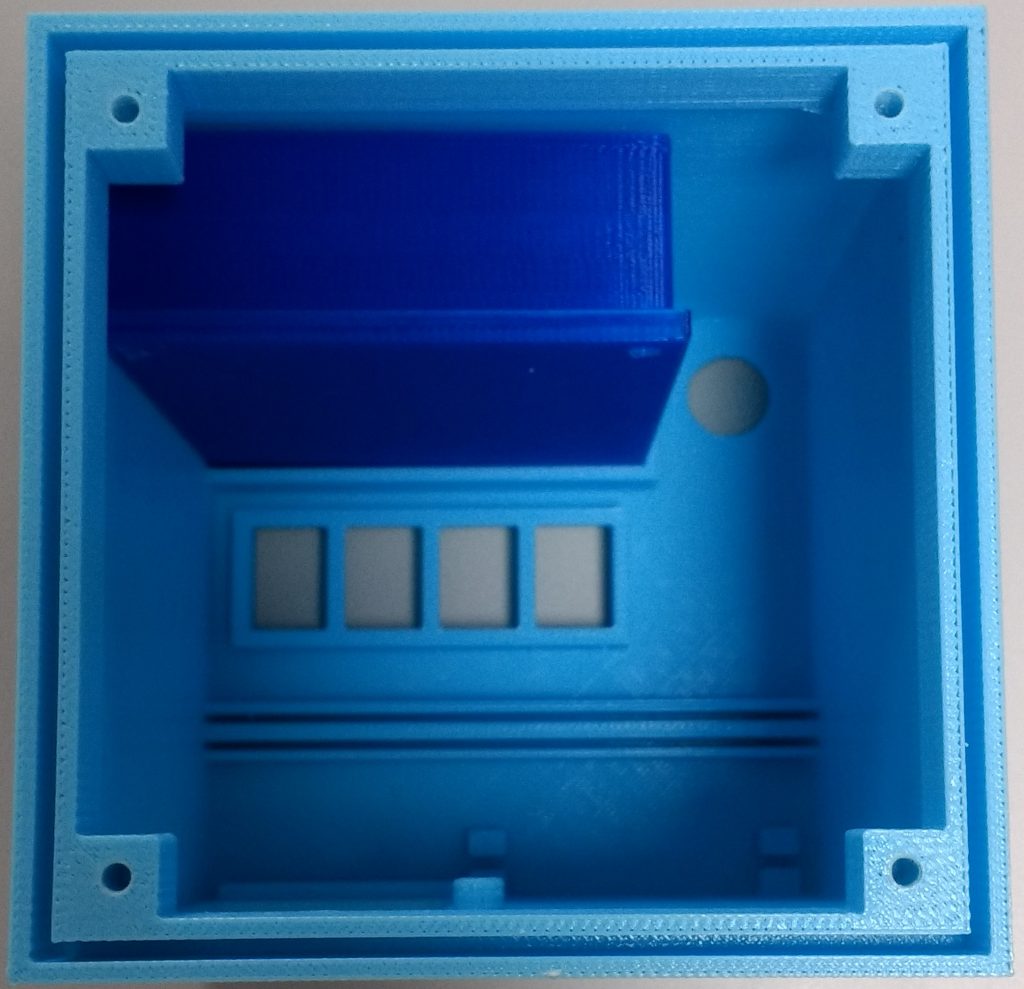
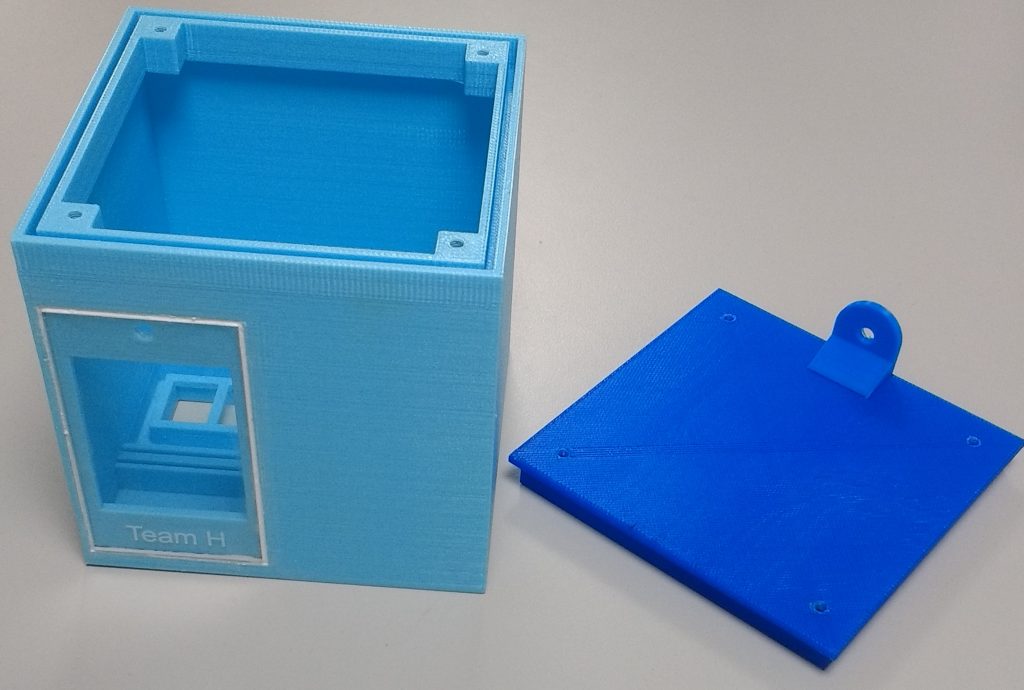
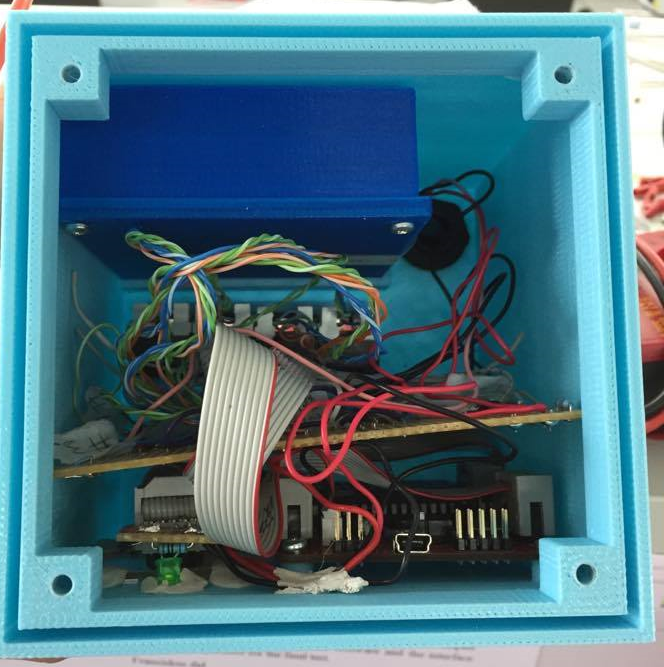
The housing was designed using SolidWorks, a CAD package, and manufactured using a 3D printer. The design was a 120 x 120 mm cube, with a recessed front face so that a transparent acrylic sheet could be glued to the front to act as a window for the Il Matto’s LCD display placed inside the housing.
Many steps were taken to prevent water ingress, to comply with the IP55 standard. The four RJ45 connections that contained all of the signals, as well as the 230V AC mains wire, were connected to the underside of the housing to minimise contact with water. The cutouts for the RJ45 connectors were recessed into the housing, and the mains wire was fed through a water tight grommet. The lid of the housing had an extended lip that slotted into the recessed groove in the body of the housing, which was lined with a laser cut rubber gasket to ensure water tightness. Lastly, four screws were used to secure the lid of the enclosure to the body.


To isolate the circuitry that converted the power supply circuitry from the rest of the components, a simple secondary housing was made that was placed inside the primary housing. Mounting dowels were printed in the interior to mount the Il Matto, and grooves were printed on the floor of the housing for the circuit boards to slot into.
Power Supply
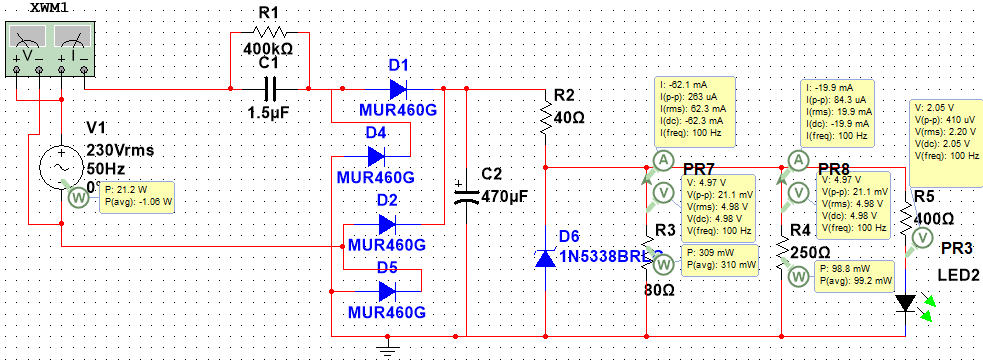
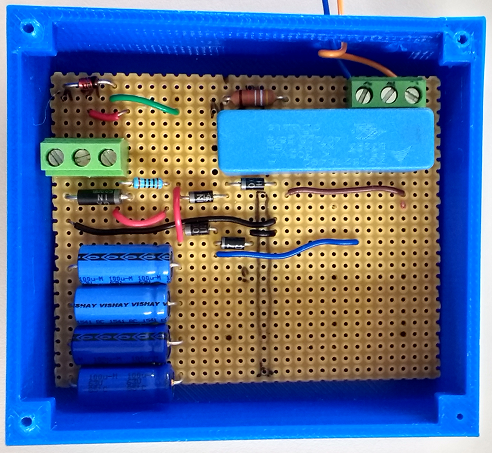
To convert a 230V AC supply to a 5V DC supply to power the Il Matto and interface circuitry, a bridge rectifier was used alongside a capacitor-coupled charge pump circuit
Interface Circuitry
The input voltage range of the Il Matto’s ADCs is 0V – 3.3V. The Il Matto output voltages can vary from 0V – 3.3V using a PWM signal which is fed through a low pass filter to smooth the signal to a DC voltage.
The required signals to switch the loads and control the battery require 0V or 5V TTL logic signals. The input signals that represent energy sources vary from 50Hz AC signals with voltages being ±4V, ±10V, and DC voltages with a range of 0V – 5V.
To convert the input signals into signals that can be interpreted by the Il Matto, and to produce output signals in the required form, interface circuitry was designed to convert the signals. This included various op amp circuits and potential dividers; more detail on this can be found in the report.
Software and display
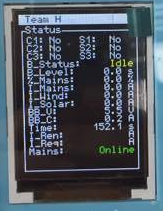
The software was coded in C, and uses precoded libraries to interface with the Il Matto’s LCD. The code was split into three main sections, a while loop that checked all of the signals for changes, a decision-making section, and a controlling section.
The while loop checks the states of the signals by sampling the various inputs. As long as there was no change to the system conditions, such as the load call changes, renewable energy changes and mains condition, the program would stay inside this while loop as the power has been effectively distributed.
When the conditions change, the program exits the while loop and enters the decision-making block. This code is based on the following flowchart:

The final block of code checks the mains voltage and applies feedback control to increase the current requested from the mains in situations where the busbar voltage (controlled by the smart meter, which the loads draw power from and the sources provide power to) varies from 240V. More information on the code can be seen in the report.
The development of the code was done using Github, with different sections being worked in simultaneously by the team members in their own branches.
Assessment
The project had three review periods, these review periods required the submission of progress reports, logbook reviews, IP55 testing, power supply efficiency testing, and simulating the smart meter on the programmed testbed against a test profile that switches different loads and varies the renewable energy supplies over a mock 24 hour period.
I received a mark of 68.6% for my contributions on this project, which made up 70% of the mark for the module ELEC2217 Electronic and Electrical Engineering Design.